
Comm100 provides prebuilt reports for Live Chat, Ticketing & Messaging, AI & Automation, Queue Management, Booking, and Global Settings. Custom Reports allow you to select the metrics and attributes most relevant to your business and present the data using configurable charts and filters.
To learn more about Comm100 prebuilt reports, see this article.
To support efficient reporting, data for each Comm100 product is organized into datasets. Each dataset contains predefined metrics and attributes that you can use to build a report.
Creating a custom report involves the following steps:
- Choosing a dataset
- Adding metrics and attributes
- Setting up chart visualization
- Filtering report data
A dataset is a collection of related metrics and attributes. For example, the Chat dataset contains metrics such as chat volume and agent response time, and attributes such as agent and chat source. You must select a dataset before building a custom report.
Available Datasets
Comm100 provides datasets for different products and reporting scenarios. Review the available datasets below to choose the one that contains the information you need.
Live Chat Datasets
- Chat: Data on chat volume and agent performance. Key metrics include chats, chat requests, wait time, and agent response time.
- Offline Message: Data on offline messages received from different sources.
- Visit: Data on visits to your website by campaign or time range.
- Chat Queue: Data on chat queue size by department or time range.
- Auto Invitation: Data on automatic invitations, including the number of invitations sent and accepted.
- Manual Invitation: Data on manual invitations, including the number of invitations sent and accepted.
Ticketing & Messaging Datasets
- Ticket: Data on tickets from messaging channels such as Email, SMS, and social messaging. Key metrics include ticket volume, channel, and resolution time.
- Ticket SLA: Data on Service Level Agreement (SLA) performance, including SLA policies, SLA targets, and SLA tickets.
AI & Automation Datasets
- AI Agent Intent Detection Record: Data on AI Agent performance, including intent answer records, collected leads, and meetings booked by the AI Agent.
- Taskbot Trigger Record: Data on Taskbot performance, including the number of times Taskbot was triggered, collected leads, and booked meetings.
- AI QA Review Item: Data on AI QA review items, including reviewed chats, accuracy scores, guideline compliance, and auto-failures.
- AI Coaching Opportunity Assignment: Data on coaching opportunity assignments, including completion rates and average completion time.
Queue Datasets
- Queue Session: Data on customer queue activity. Key metrics include queue sessions, customer wait time, and served rate.
Booking datasets
- Appointment: Data on appointments. Key metrics include total appointments, rescheduled appointments, cancellations, no-shows, and no-show rate.
Global Settings datasets
- Canned Message Usage: Data on canned message usage, including the number of times each message was used and the number of agents who used it.
- Agent Status Log: Data on agent utilization. Key metrics include agent online time, chat time, and idle time.
Step-by-Step Instructions
To start building a custom report, follow these steps to choose a dataset:
- Log in to the Comm100 Control Panel.
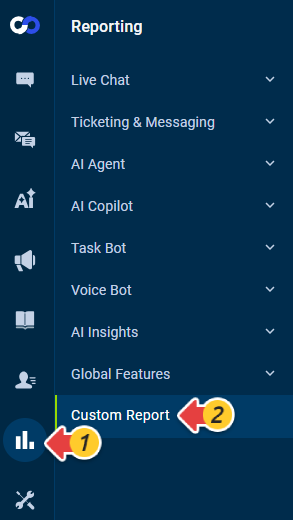
- From the left navigation menu, go to Reporting > Custom Report.
- Click New Report. The Select Dataset drawer appears from the right.
- In the Select Dataset drawer, select the product you want to report on, such as Live Chat.
- Select the dataset that contains the information you want to use in your report. You can click a dataset to preview its available metrics.
- Click Next. The page for creating a custom report appears.

Metrics are numerical values, such as the number of chats, chat messages, or agent response time. Attributes are descriptive fields used to group metric results, such as agent, ticket ID, or ticket channel. A custom report requires at least one metric, while attributes are optional.
To add metrics and attributes to your report, follow these steps:
- Enter a name for the report in the field at the top of the page.
- On the Data tab, click Add under Metrics, then select the metrics you want to include in the report. You can add up to ten metrics.
Note:
- To view a metric’s definition, hover over it.
- Comm100 automatically selects the most suitable aggregator for each metric. You can change the aggregator based on your reporting needs.
- (Optional) To change a metric’s aggregator, expand the aggregator drop-down list and select another option. The available aggregators vary depending on the selected metric.
Aggregators determine how metric values are calculated. For example, for the Waiting Time metric, you can select Sum to view the total waiting time or Average to view the average waiting time across chats. Available aggregators include:
- Count: Counts the number of records.
- Sum: Adds all numeric values.
- Average: Calculates the arithmetic mean of the numeric values.
- Maximum: Returns the highest numeric value.
- Minimum: Returns the lowest numeric value.
- Percentage: Displays the metric value as a percentage.
- (Optional) Add attributes to group the metric results. For example, you can group report data by campaign, agent, or department. You can add up to two attributes.
- Click Save in the upper-right corner. The selected metrics and attributes are added to the report.


As you add metrics and attributes, the system automatically generates a preview chart on the right using a default chart style. To customize how the report data is presented, proceed to the Setting Up Chart Visualization section.
You can configure the chart type, sorting order, and stacking options to control how your report data is presented.
To configure the chart visualization, follow these steps:
- On the Custom Report page, locate the report you want to customize and click the Edit icon.
- Click the Chart tab.
- Select a chart type. The available chart types depend on the number of metrics and Group by attributes included in the report.
- Select a sorting option for the report results:
- A-Z: Sorts attribute values alphabetically in ascending order. For example, when chats are grouped by agent, the results are sorted by agent name from A to Z.
- Z-A: Sorts attribute values alphabetically in descending order.
- Value Ascending: Sorts metric values from lowest to highest.
- Value Descending: Sorts metric values from highest to lowest.
Note: For date-related attributes, A–Z follows chronological order. For Date, results are sorted from the earliest date to the latest date. For Quarter of Year, results are sorted from Q1 to Q4.
- (Optional) For Bar and Column charts containing multiple metrics or attributes, enable stacking to combine the data series within the same bars or columns. In a Column chart, the series are arranged vertically; in a Bar chart, they are arranged horizontally.
- Click Save in the upper-right corner. The report is saved with the selected visualization settings.


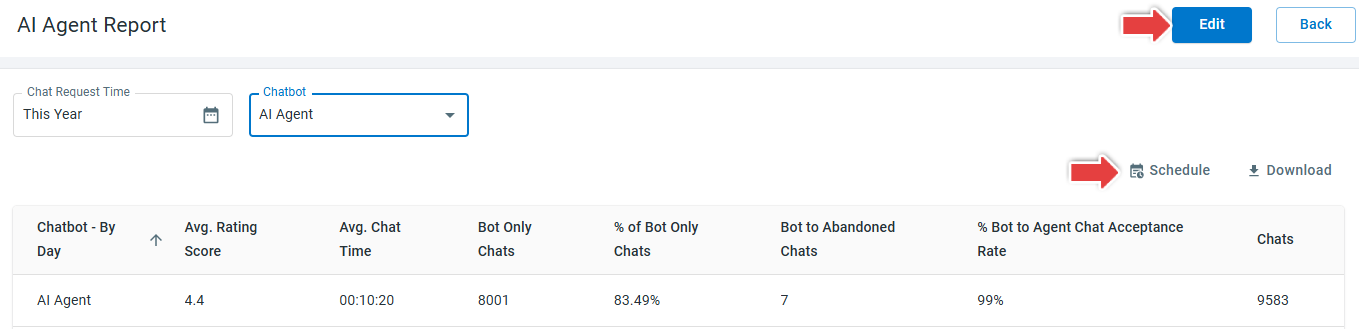
After the report is created, you can click Edit to modify the report settings, Schedule to configure automatic delivery, or Download to export the report data.
You can apply filters for one-time analysis or save them with the report for future use. To filter report data, follow these steps:
- Click New Filter in the upper-left corner of the chart.
- Select the attribute you want to use as a filter.
- Select the values you want to include in the report.
- (Optional) Add more filters to further narrow the results.
- (Optional) Click Save to retain the filters for future use.


The report updates to display data that matches the selected filters.